More cores and creative solutions!
The official CASEIS Cruise Blog is located here: http://www.ipgp.fr/caseis This official blog is written by my shift-mate Lola Johannes.
We collected our 3rd core today and are now collecting the 4th.
- I thought it would be nice to show everyone the science team. Everyone but two people in the photo below are on the first leg (so will be joining us on the second leg). I will not be on the second leg, so will be attempting to get my land legs back on 6/19. When I returned from my cruise offshore Sumatra in 2007, for the first three days, when I got out of bed in the morning, the ground would feel like it was moving like on a ship. I would sway back and forth in response to imaginary motions. This was quite surreal.

- Here, Dr. Beck is discussing with Dr. Ratzof his interpretation for the ubiquitous black layers (seen in the core here). These layers smell like Sulphur and have planktic silicic fossils (from organisms that lived in the surface water that have silica exoskeletons, like radiolaria, diatom, etc.). Dr. Beck suspects that these represent a time period (decadal to century scale) when there was a bloom of life leading to anoxic conditions (the organisms may have metabolized the oxygen in the water). This anoxic condition was possibly transported to the seafloor in some way, leading to the reduction (black). As we can see, Dr. Ratzof is ready for his well deserved off-shift break time.

- Dr. Beck was quite resourceful because he acquired some vinegar from the mess as a replacement for hydrochloric acid. This allows us to test to see if sediment is calcareous or siliceous. Much of the sediment in these cores is clay sized, making it difficult to tell the source. When calcite is exposed to acid, it effervesces. If one looks closely at the dish full of sediment in this photo below, one will see the bubbles formed by this process.
- This is an example of our resourcefulness. This is one of the clipboards that we made from plywood and binder clips while at the port before the cruise. Above that is the measuring device we use to describe the cores. We taped a sewing tape (in cm) to a stick. Crude, but effective.
- Here Dr. Beck drills holes into the end caps that we place on the core sections.
- Here is a view of the uppermost sections from CAS16-04PC. The ubiquitous “homogenite/turbidite” is in the upper three sections. We can see that there is another similar deposit in sections V and VI. In between these thicker deposits are many other thinner deposits varying from hemipelagites, turbidites, and other types.

- These are the uppermost two sections from core CAS16-07PC, a core collected in the northernmost basin that we have cored so far. In section I (on the left) is again this homogenite/turbidite deposit with its top about halfway up the core (remember the top of the core is on the far side of the table. What do you see that is different in this core from the other cores? Yes, that is right, the homogenite is much thinner here. This may be due to several reasons. If this deposit is Seismogenic (meaning that an earthquake is responsible for its deposition), then the region from where the sediment came to form this deposit may be at a greater distance from the earthquake than the other cores. As I have mentioned before, the downgoing North America plate has several fracture zones that may be controlling the spatiotemporal patterns of earthquakes along the megathrust. The Barracuda Ridge intersects the subduction zone near the location of core CAS16-07PC. While speculative at this point, the thinner deposit in this core may be sedimentary evidence of tapered slip during a megathrust earthquake due to the segmentation of the subduction zone imparted by the Barracuda Ridge. This is the topic of discussion between myself and Dr. Ratzof.

- Here is another map showing the core locations with the Barracuda Ridge and Tiburon Rise labeled (the next fracture zone to the south, which may be another source of subduction zone fault segmentation. Note the location of core 7.
- So many of these cores are absolutely beautiful. This is an example of one of these cores. Dr. Beck and I split this core and he remarked that it is so perfectly split that we do not even need to clean it before we scan it for RGB (real color) imagery. We did clean it of course. Here the two Quentins appreciate the beauty of this core.
- Here my team mates are placing plastic wrap on the cores after they have been described (left to right, Lola, Gaelle, and Chloe). After the plastic wrap, they then get placed in a plastic bag and then the D-Tubes. If these cores are curated well, they can last decades in the core repository with little degradation. If not prepared well, they won’t last nearly as long.
- One of the key parts to a smooth running operation is keeping our workspaces clean. Here Marie is cleaning the core description table before someone starts describing the next core section. We also do this at the end of our shift so that the next shift arrives to a clean laboratory. Marie is working so fast that her hands are a blur in this photo.
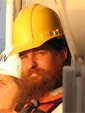
- Here are our helmets. We need to wear helmets and work boots when working on the deck with the core. Safety First!
- Being at sea, as I have mentioned, requires one to be resourceful when problems arise. After all, we cannot simply go to the market to get any supplies that are unavailable on the ship. These cores are very shiny and wet, so when we scan them for RGB imagery, they have a high albedo. This means that they reflect light back to the camera, producing scans that are so shiny that one cannot see the sediment. Dr. Herve Guyard (the post-doc working on this project) tested an hypothesis that if he placed kim-wipes (small pieces of paper scientists use to clean objects, similar in size and texture to toilet paper) on the cores prior to scanning, that they dried the cores sufficiently to produce a less shiny scan. Yet another success at sea! Here Chloe watches as Pierre applies the kim-wipe method.
- Here we can see the RGB imagery scanner mounted on a pole above the core. There is a black box that contains the light for the scan (which assures a constant light level for the exposure).
- After the cores are scanned for RGB imagery, they are then again wrapped in plastic before the photospectrometry and point magnetic susceptibility analyses. Here are Chloe and Marie doing this! The plastic allows the sensors to come into contact with the core, without getting the sensors all muddy.

- As is traditional on research cruises, Dr. Feuillet prepared and gave a presentation to the science and ship’s crew today. The attendance was high with some people having to stand outside in the hallway to see the talk. Dr. Feuillet presented background material about plate tectonics, subduction zones, the natural hazards (earthquakes, volcanoes, and tsunamis) posed for the inhabitants of the islands along the Lesser Antilles. It is because of these risks that the French Government provided financial support for this cruise. They may also fund the analysis of the data from the cruise (in France, these are separate proposals). Here is a photo of the attendees shortly before the talk began (about 10 more people showed up after I took this photo).
- Here Nathalie begins her talk.
- Here Nathalie shows a cross sectional view of the subduction zone that forms the volcanic arc and is the source for large subduction zone earthquakes along the Lesser Antilles.
- On 8 Feb, 1843, there was an earthquake with an estimated magnitude of M 8.5. As I mentioned on my initial pre-cruise blog post here, this earthquake was felt in South and North America. This is a painting showing an interpretation of the devastation experienced at the port of Pointe-a-Pitre. The volcano La Soufriere is shown in the background (though was not erupting at the time; consider this to be the artist making the devastation seem more catastrophic).
- Here is a figure from Hough (2013) showing a plot of felt reports using the Modified Mercalli Intensity Scale (MMI). The MMI scale is a qualitative assessment of the felt ground shaking and damage from an earthquake.
- Dr. Feuillet showed a couple animations of a lab experiment that shows how submarine landslides triggered by earthquakes may leave behind sedimentary deposits called turbidities. The photo below shows a small turbidity current being deposited on the seafloor (in a glass tank).
- Nathalie then shows the audience that it is in these deposits that we place piston cores to investigate for the prehistoric record of earthquakes in the submarine setting. In this slide, she also shows some CHIRP seismic reflection data from one of our core sites. In these seismic data, we can actually identify individual deposits! The uppermost homogenite is the light gray layer immediately beneath the uppermost black layer.
- Here is a site map for the cores that we have collected so far. This is similar to maps that I have previously posted. The planned sites are in green, yellow, and red that are ranked by color from high to low priority. The dots in blue show the locations of our actual core sites.


No comments:
Post a Comment