Sunday, November 13, 2016
Leaving Port
A few days in
<H2>A few days in </H2>
<ul>
<li>The R/V Tangaroa was constructed in 1991 in Bergen Norway. Below is the plaque that is mounted on the deck near where people board the ship. (I will add the photos when I can. Someone was using the computer that earlier let me attach photos to my blog. For now, I am emailing this post to my blog.</li>
DSC_0298.jpg
<li>Here is the gangplank shortly before it was hoisted prior to our departure. </li>
DSC_0301.jpg
<li>Here is the ship's bell, located on the foredeck. One needs to get permission from the bridge to access the foredeck since no science is conducted there. I had permission from Captain Evan. </li>
DSC_0271.jpg
<li>We had to bring lots of equipment aboard the ship prior to our cruise. Here is a photo of use loading the shipping container that we use as a core curation facility. We split and describe the cores in this container (sometimes called a "van). </li>
DSC_0091.jpg
<li>Here is the view from the ship as we left port in Wellington. </li>
DSC_0304.jpg
<li>We started coring in the region of Cook's Strait, the southernmost region of our planned coring sites. This region of the margin is complicated due to high tidal currents in the strait, fluvial input, and a plethora of fault trigger sources. There are many strike-slip faults that trend across the strait, in addition to the megathrust and faults in the accretionary prism. These sites would be important to work out the earthquake story in any trench cores further to the north. </li>
<li>These sites were not very successful due to their short recovered lengths. The R/V Tangaroa was initially designed for a fishing research institution, not for coring. It has since been retrofitted for various other oceanographic research studies, including coring. The coring is conducted along the starboard side of the ship, with a railroad track system. The longest cores that could be collected are 8 meters. It is not easy to take 8 meter cores, so the functionally maximum length is 6 meters. Most of these initial cores were between 1 and 2 meters long. They did not have coarse turbidites, but might have muddy turbidites (that are not visible to the eye and require CT scans to identify). </li>
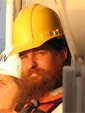
<li>Here is a photo of Dr. Alan Orpin helping receive the first Piston Core (TAN1613-2) aboard the ship. Note all the safety gear. As for all cruises that I have participated on, safety is the most important thing. Sure, we all want to get the best data and conduct the best science, but that cannot be done when people get hurt. So we follow the strictest safety guidelines at all times while aboard the ship. There is a long list of things that we can and must do and everyone participates in an induction training prior to leaving port. We conduct regular training drills to make sure that everyone is always ready to take action if necessary. The ship's crew is trained for all conceivable situations and they are trained to use the appropriate equipment when necessary. The science crew knows that they must also be ready to help in the event the ship's crew makes that request. Needless
to say, we are very excited to get this first core aboard the ship. I will show photos of what we do with the core later.</li>
DSC_0549.jpg
</ul>
<ul>
<li>The R/V Tangaroa was constructed in 1991 in Bergen Norway. Below is the plaque that is mounted on the deck near where people board the ship. (I will add the photos when I can. Someone was using the computer that earlier let me attach photos to my blog. For now, I am emailing this post to my blog.</li>
DSC_0298.jpg
<li>Here is the gangplank shortly before it was hoisted prior to our departure. </li>
DSC_0301.jpg
<li>Here is the ship's bell, located on the foredeck. One needs to get permission from the bridge to access the foredeck since no science is conducted there. I had permission from Captain Evan. </li>
DSC_0271.jpg
<li>We had to bring lots of equipment aboard the ship prior to our cruise. Here is a photo of use loading the shipping container that we use as a core curation facility. We split and describe the cores in this container (sometimes called a "van). </li>
DSC_0091.jpg
<li>Here is the view from the ship as we left port in Wellington. </li>
DSC_0304.jpg
<li>We started coring in the region of Cook's Strait, the southernmost region of our planned coring sites. This region of the margin is complicated due to high tidal currents in the strait, fluvial input, and a plethora of fault trigger sources. There are many strike-slip faults that trend across the strait, in addition to the megathrust and faults in the accretionary prism. These sites would be important to work out the earthquake story in any trench cores further to the north. </li>
<li>These sites were not very successful due to their short recovered lengths. The R/V Tangaroa was initially designed for a fishing research institution, not for coring. It has since been retrofitted for various other oceanographic research studies, including coring. The coring is conducted along the starboard side of the ship, with a railroad track system. The longest cores that could be collected are 8 meters. It is not easy to take 8 meter cores, so the functionally maximum length is 6 meters. Most of these initial cores were between 1 and 2 meters long. They did not have coarse turbidites, but might have muddy turbidites (that are not visible to the eye and require CT scans to identify). </li>
<li>Here is a photo of Dr. Alan Orpin helping receive the first Piston Core (TAN1613-2) aboard the ship. Note all the safety gear. As for all cruises that I have participated on, safety is the most important thing. Sure, we all want to get the best data and conduct the best science, but that cannot be done when people get hurt. So we follow the strictest safety guidelines at all times while aboard the ship. There is a long list of things that we can and must do and everyone participates in an induction training prior to leaving port. We conduct regular training drills to make sure that everyone is always ready to take action if necessary. The ship's crew is trained for all conceivable situations and they are trained to use the appropriate equipment when necessary. The science crew knows that they must also be ready to help in the event the ship's crew makes that request. Needless
to say, we are very excited to get this first core aboard the ship. I will show photos of what we do with the core later.</li>
DSC_0549.jpg
</ul>
Thursday, November 10, 2016
2016.11.10 First Core Site
![]()
<H2>First Core Site! </H2>
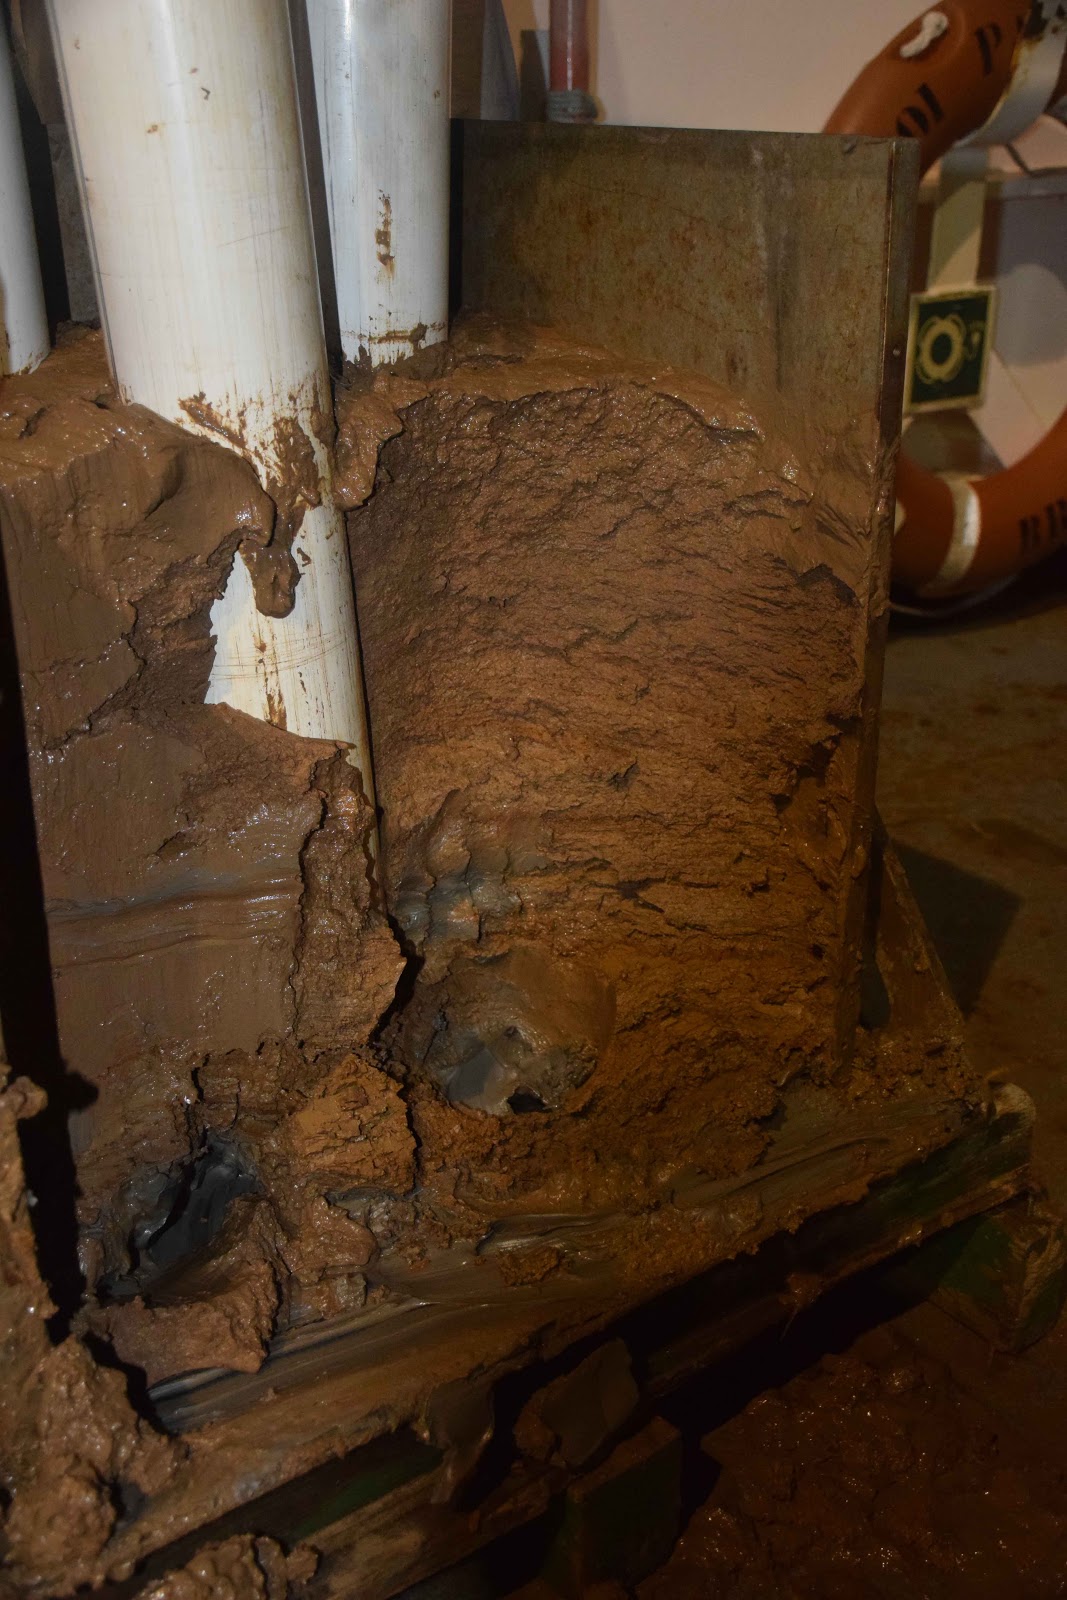
We just collected our first core in the region east of the Cook Strait (to the west of the core sites that I highlighted in the previous blog post). The core is now tied to a vertical post aboard the ship. We need to let these cores sit for 12 hours before that they can be X-Rayed. So, after breakfast in the morning, we will start working on these first cores. The core tip had almost pure clay on the tip, with no forams. The core liner is a translucent plastic and it was evident that there were gaps in the sediment (we will collect a second core here to attempt to get a more full sediment core). The piston core configuration (I will post photos later) includes a weight stand with a mass of about 730 kg. This is a small mass compared to piston cores that I have collected on other ships.
Dr. Jaime Howarth and I will be describing the sediments in the cores. Dr. Jenni Hopkins will be focusing on describing the tephras that we expect to find in the cores that we collect. Dr. Hopkins is a post doc on this cruise (she works on other data too, but will be incorporating results from this cruise into her research). There are two students who will be assisting us in these descriptions, who will be working on MS projects possibly related to the data we collect on this cruise. Drs. Howarth, Hopkins, and myself worked with Dr. Alan Orpin (NIWA) to develop the workflow for the core processing. I will discuss this more later. Suffice it to say, we have a draft plan and will update it as we find opportunities for improvement. We like to stay flexible in this regard.
Later Dr. Howarth and I prepared the lithologic description core sheets. These are paper sheets that have a template in which we write and draw our observations about the sediment cores. I include a low resolution version of this core lithologic log in this post. We incorporated some core log sheet content that I have used aboard other turbidite coring cruises, most recently the cruise in the Lesser Antilles this past summer. We modified these core log sheets to suit the needs of this cruise. We took into mind the interests of the chief scientist (Dr. Phil Barnes) and based our decisions upon the experience we have each had doing this type of work. It is important to spend considerable time designing this form so that it is (1) comprehensive, (2) easy to use (i.e. fill out), and (3) easy to use (i.e. read and interpret later). These core logs will be used for years, if not decades, from
now by people interested in our results. We will scan each core log and eventually prepare digital figure files with these data, along with all other core data.
OK, time to hit the sack. We have lots of work to do tomorrow. The first few cores are often the more time consuming cores to describe and process because we will be test running our workflow for the first time. But, once we have processed and described several cores, we will have a rhythm and these descriptions will be done in a more timely manner.
Wednesday, November 9, 2016
Planned First Core Site
2016.11.10
- We are moments from leaving the dock. I have put together a map that shows our proposed cores overlain on 250 meter resolution bathymetry data. We will be collecting piston cores (PC) at these sites, with lengths upwards of 5 meters.
- We had our first shipboard meeting at 8 AM this morning. There are 14 scientists aboard. All, but myself, are from New Zealand. Most are from NIWA. There are 4 students aboard, along with one post doc. My shipboard colleagues are providing empathy for me given the recent electoral returns back in the states. Needless to say, there is much being discussed in social media about this. I will focus on the science while aboard the R/V Tangaroa. This is a fine ship with highly competent engineers and other crew.
- Core priority is designated by color (high priority aka "must haves" = red or orange and low priority = green or blue). Our plan is to head northwards along the margin and collect cores in the very high and high priority sites. Once we get to the northernmost region of our planned survey area, we will evaluate what to do next based upon what we have observed to date. We will consider collecting additional cores in our high priority sites if those existing cores were of poor quality or possibly poorly located. We will consider collecting additional cores in med to low priority sites if the spatial coverage will be optimal for our analyses. We will also consider sites to collect multi-core cores (MC).
- MC cores are useful to collect the sediment water interface. PC cores often blow away the surface sediment when the core initially approaches and penetrates the seafloor. Having the sediment/water interface is useful for us to develop a sediment accumulation rate using 210Pb isotopic measurements. Also, the possibility of finding the most recent event will be optimized in the uppermost sediment, most likely to be in a MC.

Tuesday, November 8, 2016
Getting ready for the cruise!
2016.11.09
Getting ready for the cruise!
- We will be heading to sea to search for submarine landslide deposits called turbidites. There are several ways that these landslides can be triggered. Earthquakes are the most common landslide trigger on land and probably also in the submarine environment.
- I have worked on turbidite Paleoseismology cruises offshore of Sumatra, Cascadia, and the Lesser Antilles. These are all places where there is an active subduction zone. I have documented these cruises on my research cruise blog humboldt-jay.blogspot.com. The research offshore of Sumatra was for my Ph.D. dissertation and is ongoing. The coring we conducted offshore of Cascadia was in support of Dr. Chris Goldfinger’s research on the spatiotemporal variation in earthquakes along the Cascadia subduction zone. Recently, we received the Kirk Bryan Award from the Geological Society of America for the USGS Professional Paper 1661-F. This past summer I participated on a French cruise aboard the NO Pourquoi Pas? The principal investigator for this Caribbean cruise was Nathalie Feuillet, from Institut de Physique du Globe de Paris (IPGP) in Paris.
- We will be collecting sediment cores aboard the R/V Tangora, a National Institute of Water and Atmospheric Research Ltd (NIWA) research ship. R/V stands for “research vessel.” Here is the website that has information about the R/V Tangora. : www.niwa.co.nz/services/vessels/niwa-vessels/rv-tangaroa
Background
- Below is a map that shows the general region where we plan on taking cores. The principal investigator for this cruise is Dr. Phillip Barnes, from NIWA. Dr. Barnes has done an incredible job planning for this cruise and I outline the general strategy below. As always, we will modify our plan as our experiences during the cruise inform us.
- We will be collecting cores in sedimentary basins along the slope and in channel and other depositional settings along turbidite channel systems in the trench. We will be using classic methods (well, this is a new science, so it is funny to call these classic methods) used by many who look for seismoturbidites. We will be looking for sites that have sources of sediment that are isolated from each other. We are especially interested if these sites extend for distances larger than the length of faults that might be additional sources of ground motions that might trigger submarine landslides. We will also be looking for sites that permit us to apply the confluence test, which also requires sites that have isolated source distances that are sufficiently large.
-
I include some inset maps that have some other background material.
- In the upper right corner is a map that shows the general plate tectonics of this region. This comes from Mike Norton via Creative Commons. The Pacific plate: Australia plate relative plate motions are shown in orange. Note how the plate motion is increasingly oblique as slip is transferred from the Kermadec-Hikurangi subduction zone systems in the north to the Alpine fault system (via Marlborough) in the south, then again to the subduction zone even further south.
- In the upper left corner shows seismicity as plotted by Wallace, et al. (2009). These are earthquakes from 1990 through December 2007. The figure on the right shows the deeper events with their depth represented by color.
- In the lower right corner is another figure from Wallace et al. (2009). This one shows more detailed fault mapping in the accretionary prism. These are offshore thrust faults that are additional sources of ground shaking for triggering turbidites. It will be important to be able to extend our correlations beyond any individual fault system to be able to link any given correlated turbidite to ground motions from the megathrust. There are also some strike-slip faults that may also confound our analysis, particularly in the southern Hikurangi margin. In this inset is a cross section showing that the accretionary prism is composed on imbricate thrust faults. These are the additional sources of ground shaking that are mapped in plan view on the map (labeled “Forearc domain” in the cross section).

- Here is the plot from Wallace et al. (2009) that shows the seismicity from 1990-2007.
- Here is the map from Wallace et al. (2009) that shows the regional and local tectonics in the Hikurangi Trough.
Tectonic setting of the Hikurangi margin. Modified from Barnes et al. [2009], copyright 2009, Elsevier. (a) Detailed bathymetry (NIWA), topography, and active faulting (black lines) of the onshore and offshore subduction margin. Dashed contours indicate sediment thickness on lower plate from Lewis et al. [1998]. Bold white dashed line shows the back of the accretionary wedge and the front of a deforming buttress of Cretaceous and Paleogene rocks covered by Miocene to Recent slope basins [from Lewis et al., 1997; Barnes et al., 1998b, 2009]. A–A0 line denotes cross-section location in Figure 1d. Dashed black lines show locations of seismic reflection lines from Figure 4, labeled by line number. White arrow shows Pacific/Australia relative plate motion in the region from Beavan et al. [2002]. Onshore active faults from GNS Science active faults database (http://maps.gns.cri.nz/website/af/). TVZ, Taupo Volcanic Zone; NIDFB, North Island Dextral Fault Belt; LR, approximate location of Lachlan Ridge; KR, approximate location of Kidnappers Ridge. (b) Broader-scale New Zealand tectonic setting. (c) Regional tectonic framework. RI, Raoul Island; NZ, New Zealand; HT, Hikurangi Trough. (d) Interpretive cross section across the strike of the subduction margin. Cross-section location denoted by A–A0 line in Figure 1a.
Here are some of the inset maps on their own, with their original figure captions as blockquotes.

Selected seismicity between January 1990 and December 2007 (inclusive), from the GeoNet database (http://geonet.org.nz). Events shown are only those which were recorded by six or more stations, with nine or more observed phases, with unrestricted location depths, and RMS of arrival time residuals less than 1.0 s. Magnitude range of events shown is 0.29–6.99. (left) Events shallower than 33 km. (right) Events greater than 33-km depth.

- Here is a figure that shows our existing knowledge of the historic subduction zone earthquakes for this region (Wallace et al. (2014).
Tectonic setting of the Hikurangi subduction zone at the boundary between the Pacific and Australian Plates. Black contours show the depth to the subduction interface (Williams et al., 2014). Red dots = historical subduction thrust events (all MW < 7.2). Gray dots = continuous GPS sites (http://www.geonet.org.nz). Arrows show convergence rates at the trench in mm yr–1 (Wallace et al., 2012a). PB = 1947 Poverty Bay earthquake. TB = 1947 Tolaga Bay earthquake. WF = Wairarapa Fault, the site of the 1855 earthquake. BL = Big Lagoon. MP = Mahia Peninsula. Black lines onshore are active faults (http://www.data.gns.cri.nz/af). In the forearc, most of these faults are either right lateral strike-slip or reverse. The strike-slip faults help to accommodate the margin-parallel component of relative plate motion.
- Here is a figure that shows our existing knowledge of the prehistoric subduction zone earthquakes (Paleoseismology) for this region (Wallace et al. (2014).
Map in upper panel shows locations of published Holocene records of coseismic vertical deformation along the Hikurangi Margin. Timeline in lower panel shows the approximate ages and types of impact found at different sites along the margin (note that this is an overview that does not show individual dates and their errors). We use black horizontal lines on the timeline to indicate times when vertical deformation occurs at multiple sites along the margin (summarized in the right panel of the timeline). These lines are also used on the map to indicate the approximate lateral extent of deformation and the strength of evidence for occurrence of a great subduction thrust earthquake. *Site 1: Clark et al. (2011) and Hayward et al. (2010). Site 2: McSaveney et al. (2006). Site 3: Berryman et al. (2011). Site 4: Hayward et al. (2006). Sites 5 and 6: Cochran et al. (2006). Site 7: Berryman (1993). Site 8: Wilson et al. (2006).
Here are some figures that show the historic and prehistoric history of earthquakes in this region, with their original figure captions as blockquotes.


- Wallace et al., 2009. Characterizing the seismogenic zone of a major plate boundary subduction thrust: Hikurangi Margin, New Zealand, Geochem. Geophys. Geosyst., 10, Q10006, doi:10.1029/2009GC002610
- Wallace, L.M., U.A. Cochran, W.L. Power, and K.J. Clark. 2014. Earthquake and tsunami potential of the Hikurangi subduction thrust, New Zealand: Insights from paleoseismology, GPS, and tsunami modeling. Oceanography 27(2):104–117, http://dx.doi.org/10.5670/oceanog.2014.46.
References
Sunday, November 6, 2016
test with image

tectonics of the region.
Jay P.
---
This email has been checked for viruses by Avast antivirus software.
https://www.avast.com/antivirus
Sunday, June 19, 2016
Leg 1: Success
The official CASEIS Cruise Blog is located here: http://www.ipgp.fr/caseis This official blog is written by my shift-mate Lola Johannes.

Leg 1 Comes to an End on 2016/06/20; Leg 2 begins 2016/06/21
- We are preparing to core our final cores here on the bridge. From the left are Jean Marie, Dr. Feuillet, Theo (the engineer controlling the ship at the bridge), and Dr. Leclerc. We have an upcoming paper plane competition and Nathalie has two prototypes in her hands. Awards will be based upon overall points, longest flight, best design, and most acrobatics.
- Dr. Christian Beck presented material on sedimentation in a marine setting. He discussed the various inputs, different depositional processes, and the deposits that we have observed in the cores during leg 1 of this cruise.
- What was almost our last piston core for leg 1 returned to the ship in the shape of a pretzel. The core did not penetrate much into the seafloor, so bended to absorb the force of the weight stand.
- Here the 8P-12A shift cuts this core CAS16-28PC. From left to right, Olivia, Artur, and Eva. The sediment at the top and base of the core was 99% organic matter (partially decomposed woody debris. I strongly advocated for a box core at this site. We did not know what was in the PC core (only 1 meter long) and a box core could be used to establish (1) depositional rates here and (2) whether recent seismicity was recorded at this location.
- Here Artur and Eva clean and label this core.
- Dr. Feuillet and the captain discuss her stereo microscopic observations of the organic woody debris.
- The location of this and the box core CAS16-29BC are at the middle of the red line in the map below. Color represents depth and the color scale on the right shows red = shallow and blue = deep. The blue areas are in the trench. The green/orange areas are (1) on the left, the accretionary prism and (2) on the right, the Barracuda ridge (associated to a fracture zone and likely controls segmentation of the subduction zone).
- Here is a view of the seafloor surface as collected in the box core CAS16-29PC. The surface is an oxidized red-brown clay.
- Here Marie and Dr. Ratzov watch Dr. Beck insert one of the sub-sampling cores into the box core. We drilled holes into the pipe and are using a threaded rod as a handle to insert the pipe.
- This is an exposure of 29BC. Quentin D. is pleased that this core contains interesting stratigraphy. The base is a grey-green clay. As we remove sediment so that we can collect the sub-sample cores, we learn more about the stratigraphy.
- This is a close up view of the core after we removed some sediment. This is a great way to see the stratigraphy. There are reddish brown layers and these layers appear to have a high organic content. The CT data from these cores will be very interesting. We do not see any turbidites here, but muddy turbidites are difficult to see with the naked eye. There are some parts of the stratigraphy that appear to not be laminated like the reddish brown layers.
- We moved the ship to a nearby location to take another piston core. Here the engineers change the core position from horizontal to vertical.
- Here Theo and Martin discuss the ship’s operations as we conduct seismic surveys for the remaining of leg 1.
- Here is a compilation map showing the location of all our cores locations cored on leg 1 of CASEIS.
June 19, 2016


Subscribe to:
Posts (Atom)